

When it comes to sector growth, a static snapshot can be misleading. A sector that looks strong today might be coasting on past success, or one that appears small might be quietly accelerating towards a crest.
If we want to shape industrial strategy and regional development effectively, we need to know whether we’re riding a wave or fighting to arrest a decline. That’s why we developed the Sector Growth Index (SGI), a tool designed to reveal not just where sectors stand today, but the trajectory they are on.
Over the last five years, the growth performance of the IS-8 has shown no consistent link to their share in a local economy. In other words, having a large concentration of these sectors doesn’t automatically mean they’re growing faster than elsewhere.
That matters, because understanding whether a sector in a place is rising or falling is key to deciding the right type of intervention.
The reality vs. the ideal
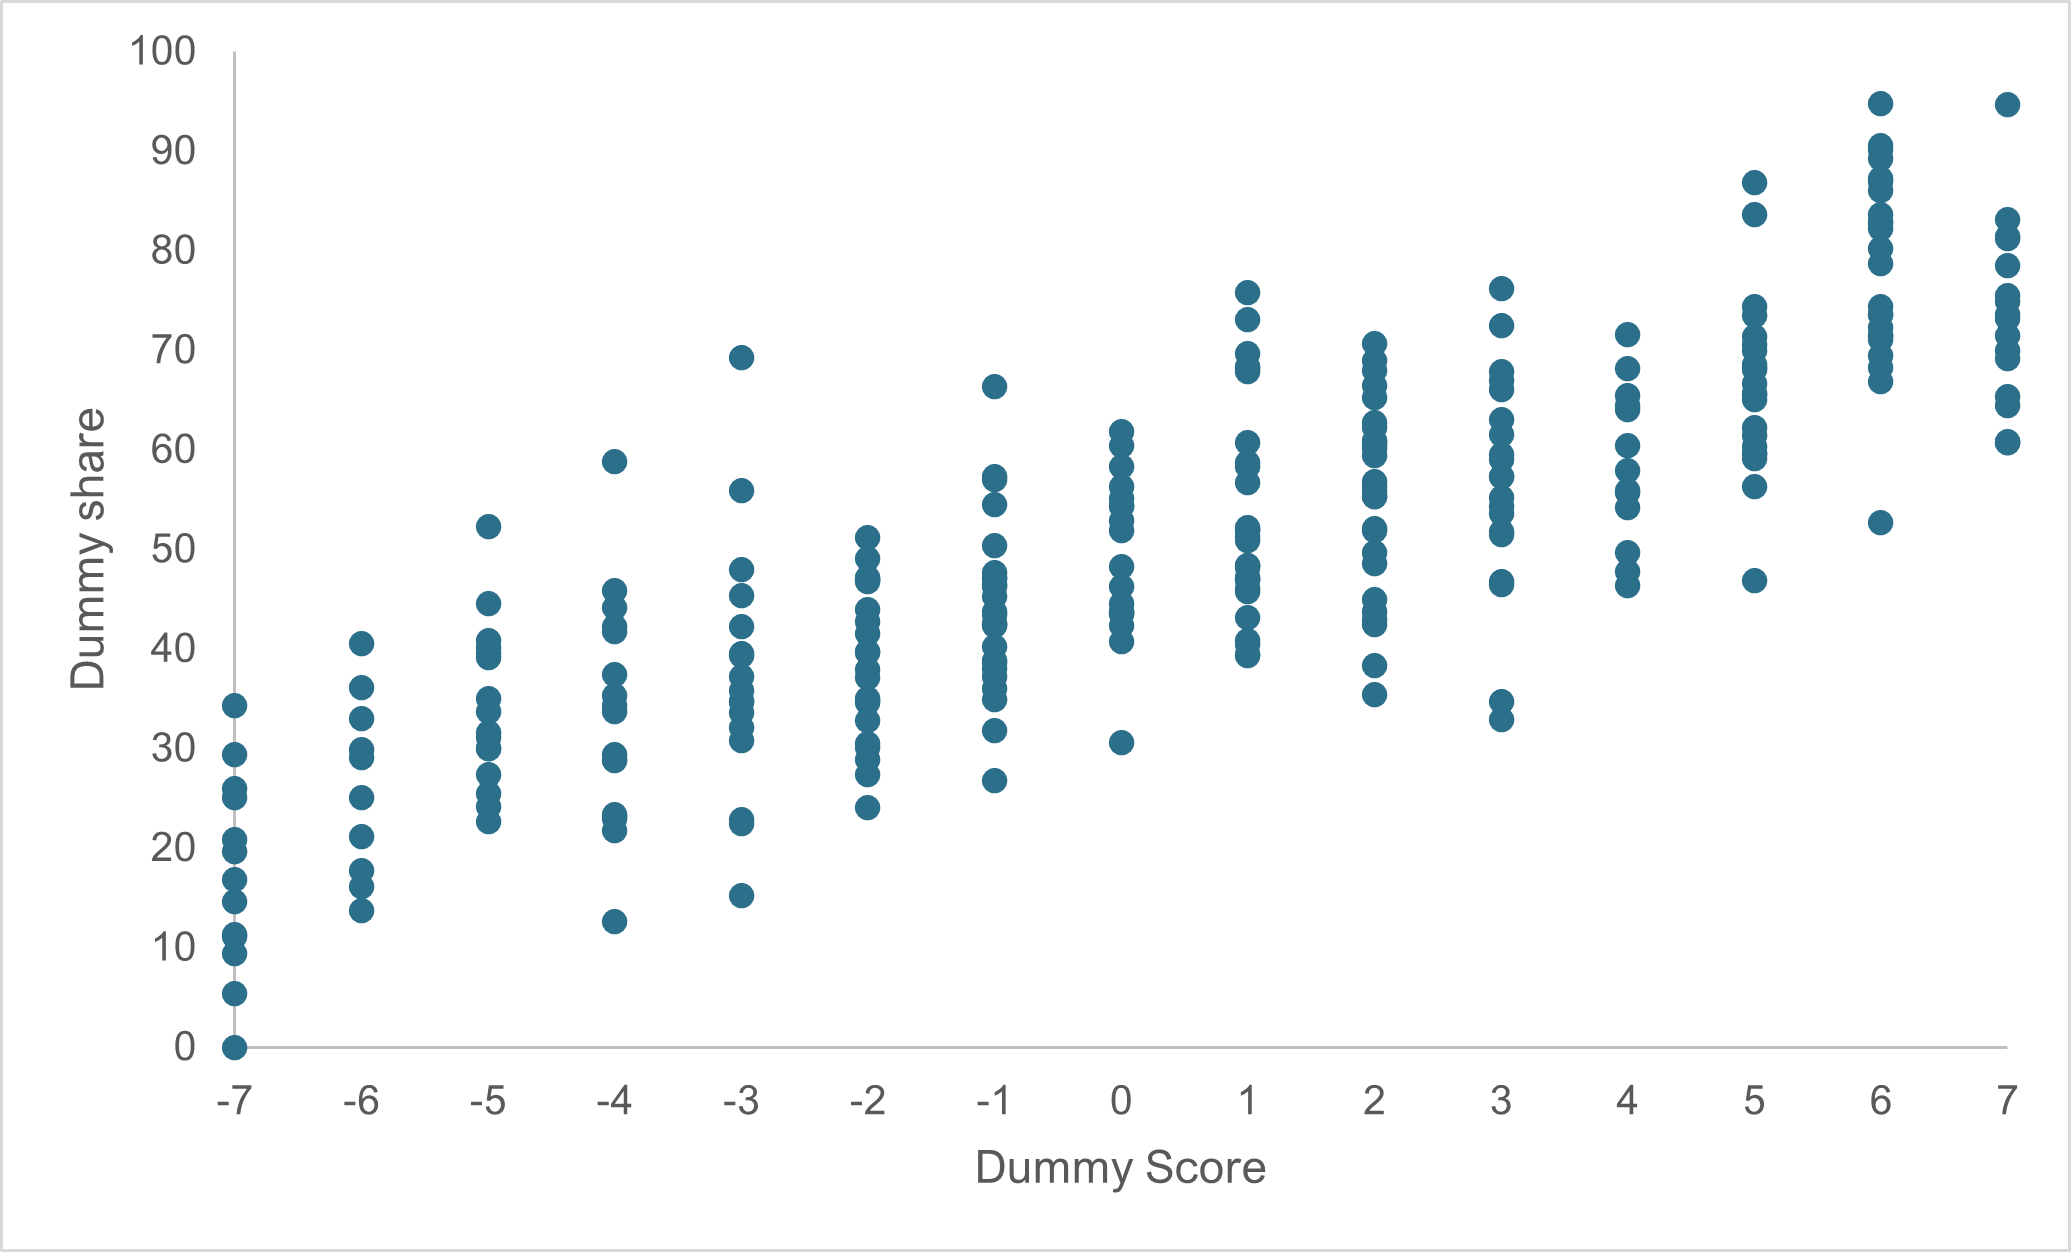
If every place with a current strength in these sectors was on a positive trajectory, the relationship between SGI score and share of employment would be simple: more employment would equal stronger growth. Figure 1 (synthetic data) shows what that would look like.
Figure 1. The Ideal - using synthetic data
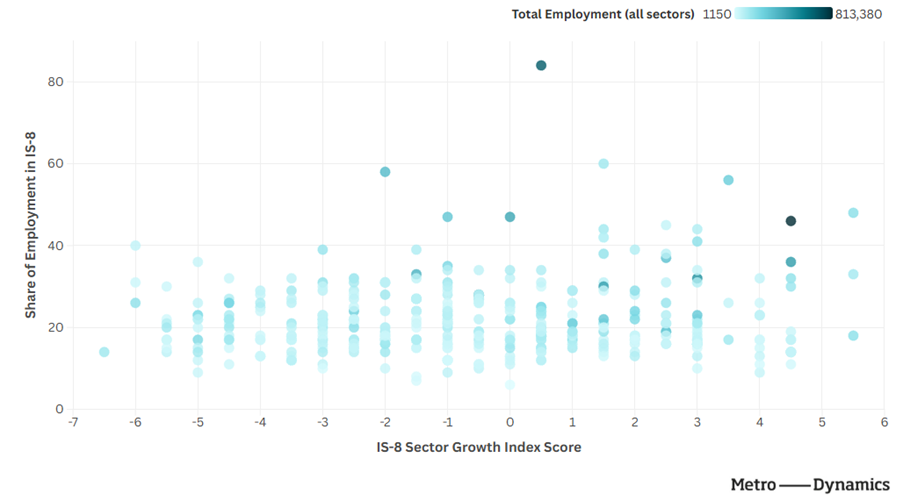
But in reality, the picture is much messier. The scatter plot in Figure 2 shows SGI score against employment share for every local authority. The colour scale indicates total employment across all sectors, giving a sense of where differently sized places sit.
Figure 2. The Reality – growth performance and employment share in IS-8 sectors by local authority using the Sector Growth Index
You can access an interactive version of the scatter plot showing SGI score against employment share for every local authority here: https://public.flourish.studio/visualisation/24679185/
The conclusion?
The growth path of these sectors is unrelated to their share of local employment. Which means static, point-in-time analysis risks missing the dynamics that matter most for long-term strategy. By tracking both current performance and recent history, the SGI helps policymakers and economic planners answer the most important question: Is this a wave worth riding or a decline that needs intervention?
How the Sector Growth Index Works
The SGI score combines:
Employment
Business counts
GVA and GVA per job
Change over time
Performance relative to national trends
Possible values range from -7 to 7. A maximum score means a sector is growing across all dimensions and outpacing national growth rates.
Our online snapshot focuses on headline performance across the Industrial Strategy sectors (the IS-8). But this is only the start: we’re digging deeper into subsector performance, exploring the foundational sectors that underpin them, and carrying out more granular spatial analysis to map their geography within and across places.
Online snapshot here: https://www.metrodynamics.co.uk/growthindexdashboard
To find out more get in touch with fiona.tuck@metrodynamics.co.uk or gillian.oconnell@metrodynamics.co.uk